

Time and Emotion
Our brains operate better in some states than others. FLOW is the optimal state.
This post describes a 21st Century timesheet that utilises FLOW tracking to increase knowledge workers’ productivity.
We will cover some theory that is relevant for knowledge working, examine trends that suggest a change is coming to the way we assess and monitor our productivity. A real world example of the new tool shows how I have used it. You are then invited to help yourself to the open source material.
Edith Penrose famously described knowledge as slippery. If you want to measure and then improve the ‘slippery’ elements that are essential for successful knowledge working, especially in agile teams and the supporting processes, this is for you.
As Gary Hamel notes: “initiative, creativity and passion are gifts. They are benefactions the employees choose day by day, and moment by moment, to give or withhold. They cannot be commanded”.
In short: Time and Motion is being complemented by Time and Emotion.
What will be covered?
This will show a time and mind-state recording method that I think is useful for knowledge workers.
The process to capture and analyse data will be described through screenshots and an interactive chart. At the end I provide links to the Minimum Viable Product. It is an open source, collaborative initiative. It is for you to use as you want.
I will describe a process I have been using in ‘Pasteur-a-like’ mode for the last year. I have had an interest in measuring this type of stuff since 2011 when I did a knowledge management elective during an MBA. Knowledge Management is an extremely dry subject. There are popular writers that make it accessible such as: Dan Pink, Malcolm Gladwell, Daniel Goleman, Nick Milton and Daniel Kahneman.
In Dan Pink’s book ‘Drive – The Surprising Truth About What Motivates Us’ he proposed that Mihály Csíkszentmihályi’s Flow Model is a more relevant tool for knowledge workers than Maslow’s hierarchy of needs. Dan then asked how the model could be practically used.
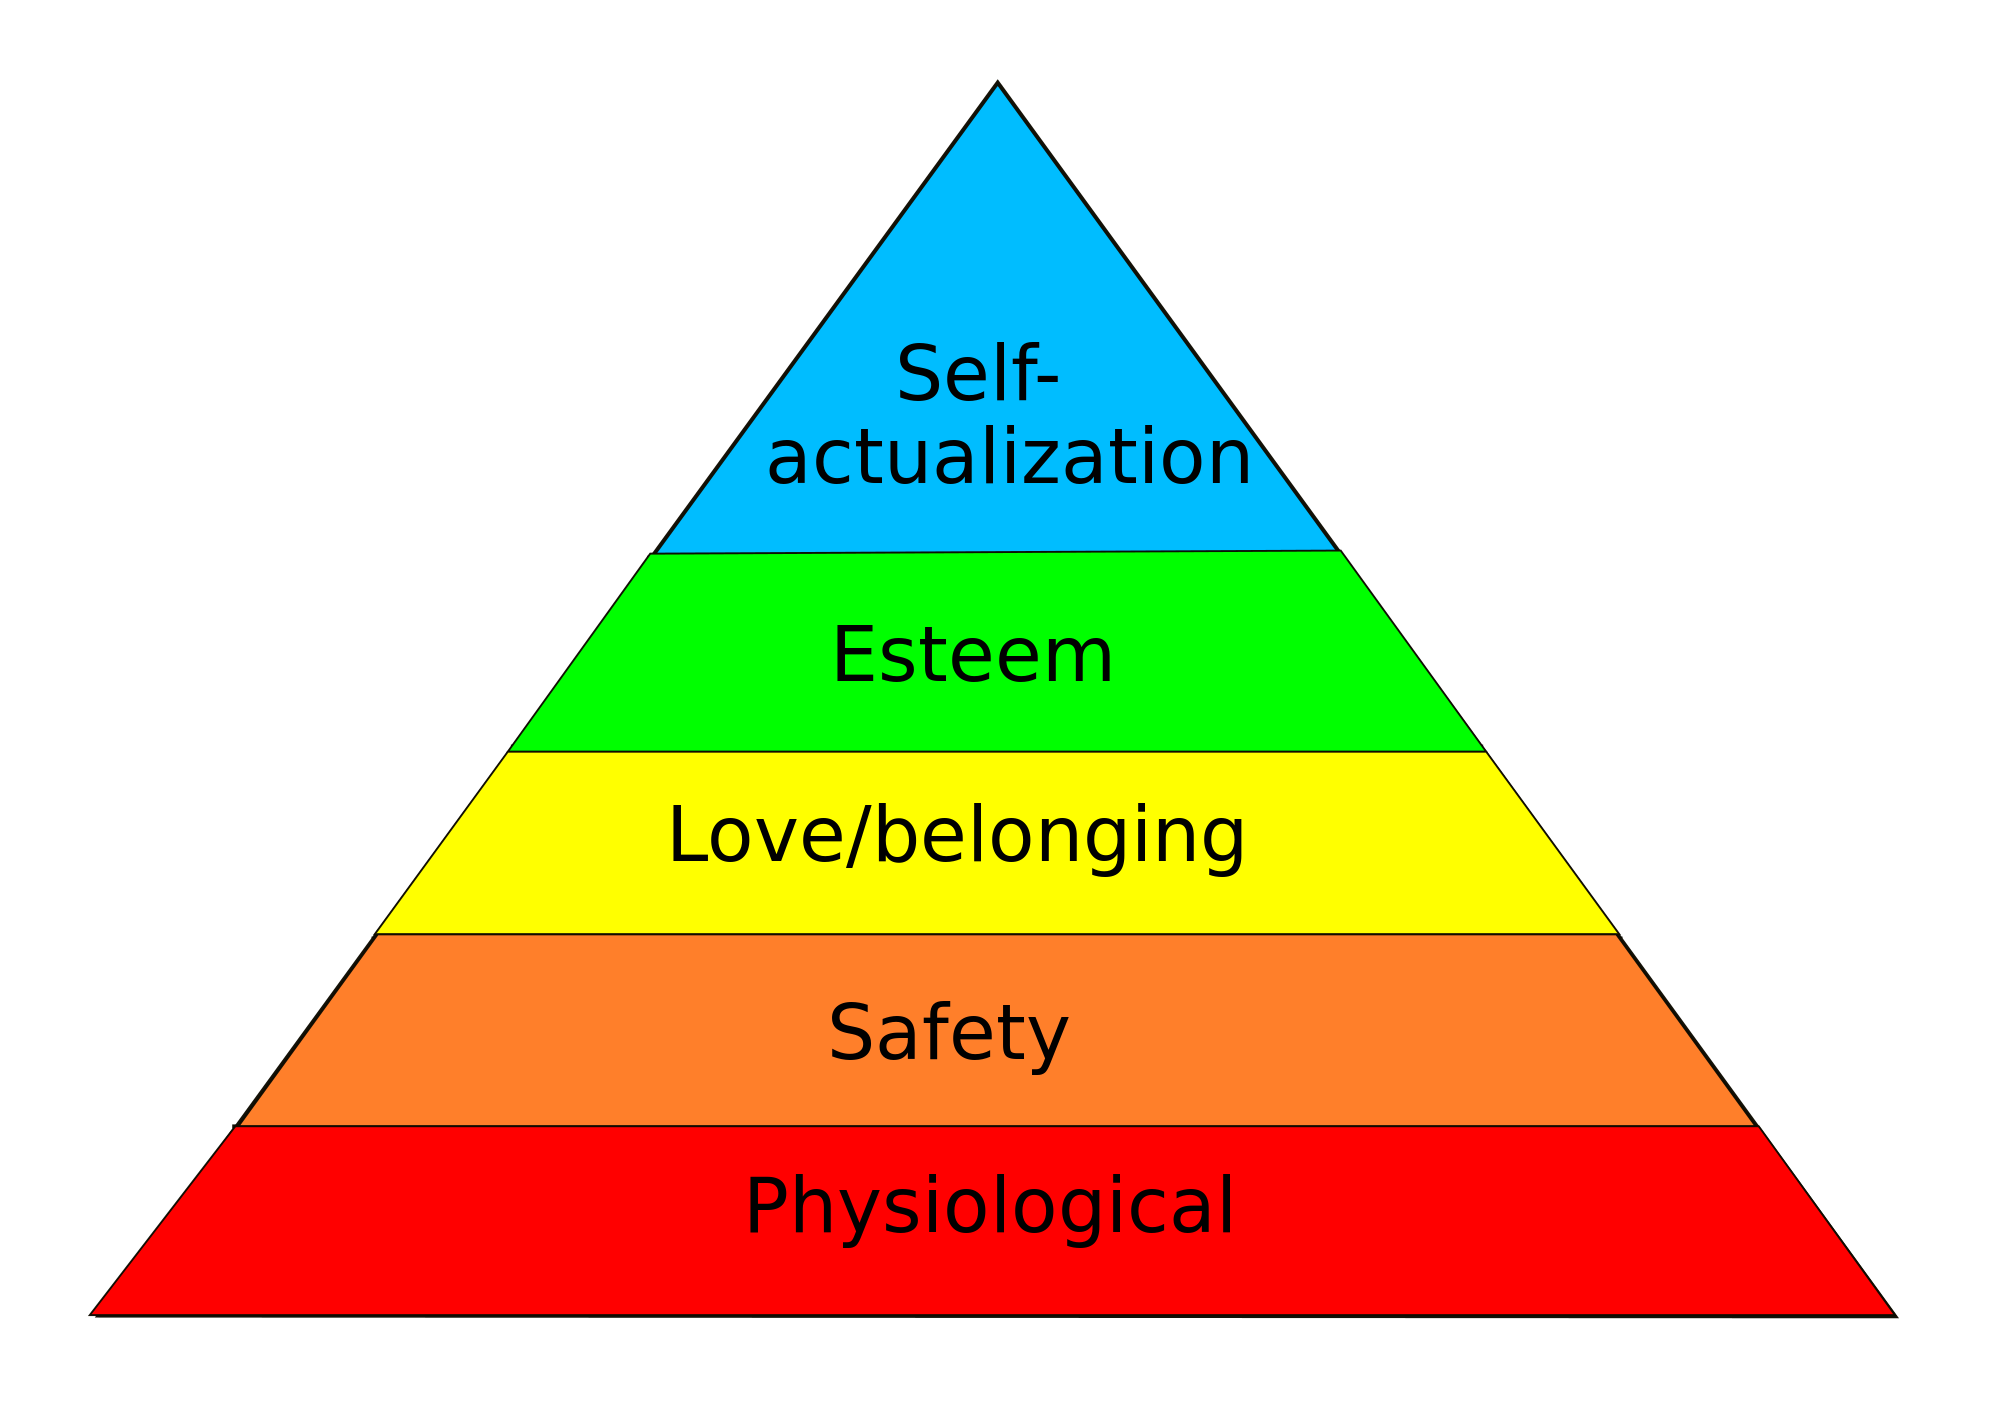
To briefly recap Maslow’s model shows a hierarchy of needs. It is generally accepted that in Western terms the Physiological, Safety and Love/belonging needs are taken care of these days. Esteem and self-actualisation are the two levels that appear to be the motivators for knowledge workers.
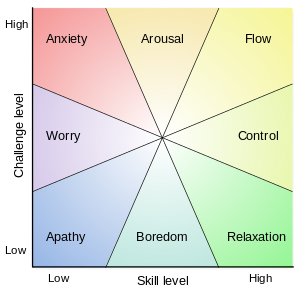
Below is the Flow model in case it is new to you. In essence it suggests that we produce our best work with the correct mix of challenge for our skill levels. It provides insights into the upper layers of Maslow’s hierarchy of needs.
A good servant leader will always try to help self organising teams create a local culture (climate) that provides the best level of challenge for the individuals’ skills. Some of the labelling is not applicable to what we do at work so I have taken some semantic liberties as I will show later.
. 
Pondering Dan’s question, and chatting with The Guild of Provocateurs it struck me that there was a similarity between changing mind-states and musical harmonic analysis. It is the change of state during work activities that are important to capture. I decided to record them, find patterns and see if any new insights about about my ways of working would emerge.
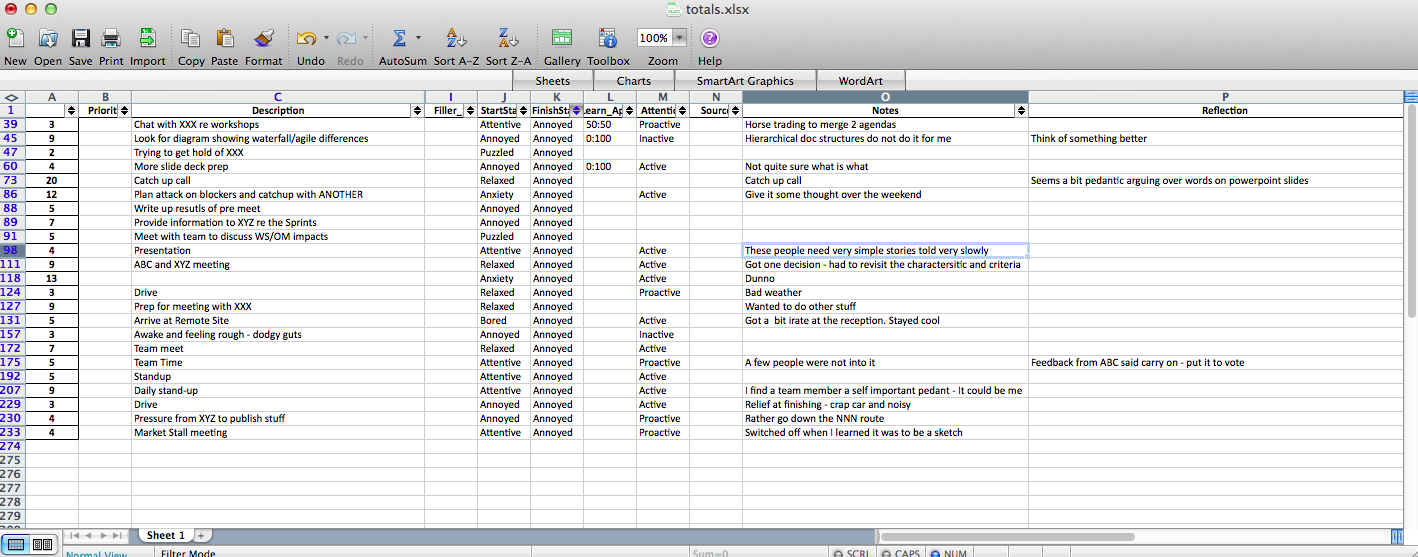
The simplest form of making a viable yet flexible recording tool was to use Excel. The timesheet (yawn!) below has extra columns for flow state (start and end), learning/application and productivity. The values are selected using drop downs – keeping the typing minimal. For the purpose of this overview I will focus on the Flowstate tracking. (It is after all a minimum viable product)
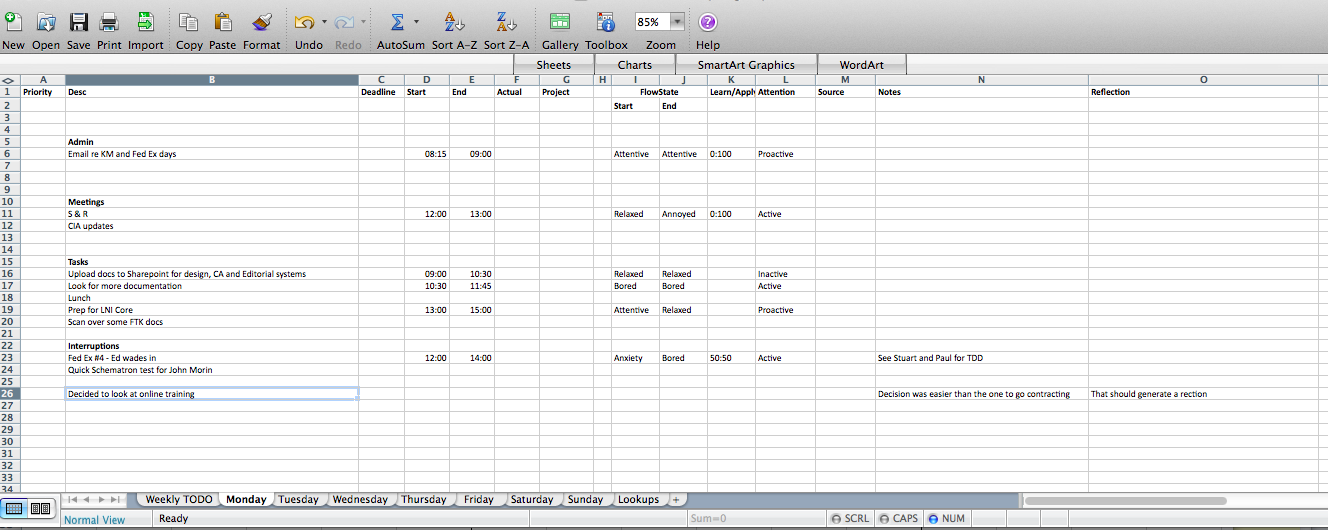
The mind-states I currently track are: Annoyed, Anxiety, Attentive, Bored, Flow, Panic, Puzzled and Relaxed. They are not fixed and may well change as I receive feedback and the system evolves based on real user needs. It is easier to start with something small than nothing at all. (I anticipate that some Psychology purists will say I have broken the model. That’s fine)
I appreciate that it may be a chore filling in a timesheet – but you already do anyway, don’t you? At least this one provides information about your favourite topic of conversation. You can always cut and paste the time information into your corporate one – and keep your personal observations as protected as you want.
Why does it matter?
Lets take a quick outside-in (STEPLE) overview of trends that may affect our work practices over the next few years.
Social: More people use personal trackers for fitness, even with the data held centrally. There is a well known knowledge company working with a F1 racing team to develop the current driver physiology trackers. It is expected that the knowledge company staff will be mandated to use the tracker.
Technological: We accept that our internet usage is tracked by commercial and security services. Wearable technology will make monitoring physiological and neurological functions possible. This re-enforces the social aspect.
Economical: It is likely that savvy employers who want to attract the best staff will ask for proof of their work. In time as tracking establishes itself as a useful tool they may ask for similar metrics as part of their selection process. (This sounds draconian – but no more so than positive vetting). It therefore falls to responsible individuals to be prepared for such eventuality – just to get to the first stage of a selection process.
Whether or not there will be political or legal precedence I do not know. But judging by the tools that are appearing to monitor productivity and the ones that are already used by military and law enforcement I would lay my money on the use of trackers rising. Ownership of the recorded metrics will be contentious. I suggest getting ahead by doing your own tracking control – rather than have it imposed by a company. That is why I offer the software open source and encourage you to blend your own versions.
I will save the environmental aspects for a metaphor that highlights the main differences between the manufacturing and knowledge era ways of work. Complementing the outside-in we can consider the inside-out view by considering potential uses.
At a glance – potential uses
Self
There is a trend towards mindfulness, which is to be applauded. The problem with mindfulness is that it is primarily a form of self-reporting and therefore open to bias.
Reflective Practice. When I received my management chartership I was informed that I had to keep 7 years logs of reflective practice – and that they can be called on at any time. I needed a tool to help carry out my 6-monthly Kolb reporting. Again this is self reporting – but I usually share with people I worked with. It rings true with them and some interesting offshoots have come via those conversations.
Coherence. Dr Alan Watkins has a more comprehensive and integral theory of how our working environment impacts on our physiology, emotions, feeling, thinking, behaviour and ultimately results. It seems left field drawing on references from Ken Wilber and Steven Strogatz but there is enough to make it ring true.
Self Organising Teams
Agile teams are used to reflecting on their processes. Sometime teams use use weather charts and others Nico-nico charts to figure out their general morale levels. If you have used them you will know that they are guides towards general feeling rather than identifying what, why and when people are being knocked off high performance levels.
This tool can help identify the lower level details – and the true impediments to productivity. If you have read the book: ‘Creative Climate Change’ that Keith Burnett and I wrote you will appreciate that we advocate each team being encouraged to affect their own climate, where climate is team-level culture. It is much easier to implement change this way rather than the blanket HR view of writing a mission, vision and set of values and then think that everyone will adhere to it. This tool complements climate control, in an organisational context.
Organisations
Companies that take time to create great team climates are unlikely to want their cultures disrupted. I suspect that, in time, their selection processes will be more refined and robust. It is not beyond the bounds of credibility that output from this, or tools like it, will be asked for prior to interviews to ensure more successful placements.
How I used the method
I work as a consultant. In 2014 I carried out two assignments that allowed me to capture enough information to test the concept. The results will be shown after this brief overview of the method. The method was very simple: Time and Emotion are the 21st Century’s evolution of Fredrick Winslow Taylor’s Time and Motion. (His initials make a an anagram that sums up my attitude to time sheets – normally.) The ultimate objective is creating business value. This tool is simply one way of helping us as individuals deliver our best. The better we can understand and improve our productivity to organisations the more our market value rises. ‘Nuff said.
I had Excel running on my laptop. I loaded a template timesheet for each week. I filled it in as I went – rather than trying to recall everything on a Friday afternoon. I stored each week’s files in a folder, called logs (really?!), and used a naming convention of starting each file with the date of the Monday in the current week in YYYY MM DD format so that they would be in the correct order for the fiendishly simple aggregation algorithm. I ended up with about 13 weeks of logs for each job.
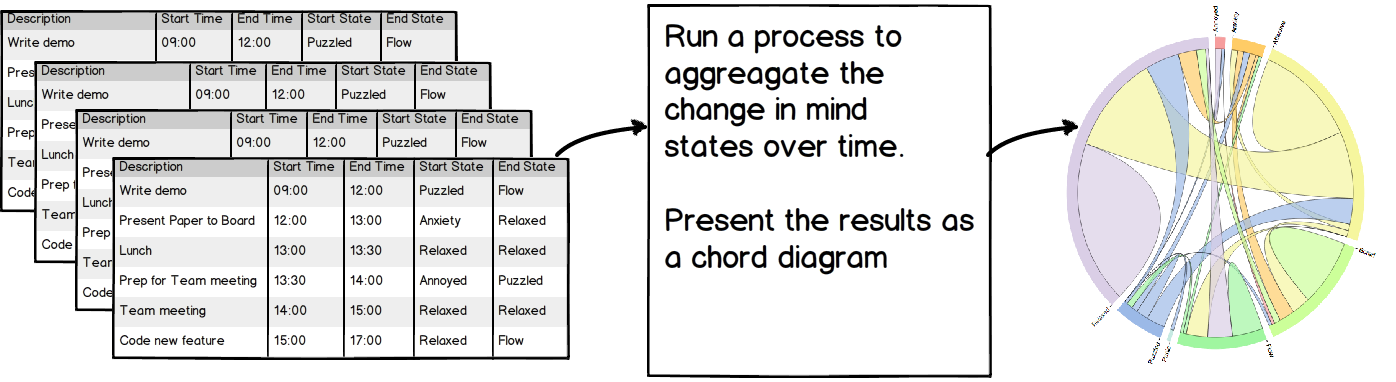
After I had a few weeks worth of time sheets I ran a simple IPython notebook to create an overall aggregation and generated some pretty charts using d3js. I find the analysis informative but do understand that a lot of people need time to appreciate the richness of big-data visualisations.
Results
Here is a screen shot of a set of results below with the Annoyed segment between 12:00 and 1:00 selected. If you click on the image below an interactive version will appear.
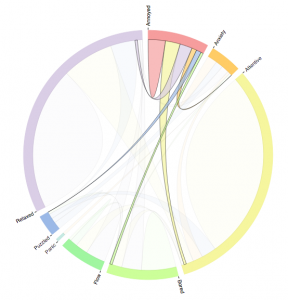
The lines between the circumference are the relative amount of state of changes. The colour of the line between two different segments is the start-state. An overview of chord diagrams and other big-data visualisation is available on Mike Bostocks informative and eye-catching site http://d3js.org
Overall I was happy with the way I was primarily Attentive and Relaxed. In terms of trying to continuously improve I wanted to find out what type of things had been annoying me so that I will be better prepared for the next assignment. There will be other things that come up that are unique to each job.
For the sake of brevity I shall refrain from doing the comparison between the two jobs. Suffice to say I found some interesting insights.
As part of the processing a totals sheet is produced that allows drill-down through column filtering in Excel. This tool is still at Minimum Viable Product (MVP) stage – and is going through alpha testing with some Data Scientists. If there is enough interest from the feedback team I will produce more interactive version of the analysis charts to provide drill down from the graphics. As the software is open source you are encouraged to make your own amendments and share
Looking at the kind of things that were annoying it would appear that I was running into resistance moving a team from their Command & Control way of working to a more agile approach. There are more contextual details that I am sure you appreciate I cannot share. I am bound to confidentiality agreements that I respect.
I could then use the information about what had been annoying me to inform my Kolb Reflection. The main bug-bear was fact that having to work between two cultures (traditional and radical) – both of which were serving the same master, but not very effectively made me realise that one way forward is to provide the training that is needed to help middle managers and governance agents appreciate agile. And perhaps realise that a zealous approach to agile can sometimes generate fear and loathing in the PMO.
The middle line need to appreciate the changes that are essential to move from command and control methods that are based in large part in aping production lines and more to the ways of working that promote stewardship of learning, mentoring and coaching. Foreman mentality needs to be replaced by something akin to Estate Management, metaphorically. In short using a log that let me identify and extract activities that had made me annoyed I could surface the bigger picture. Here is a way of looking at it.
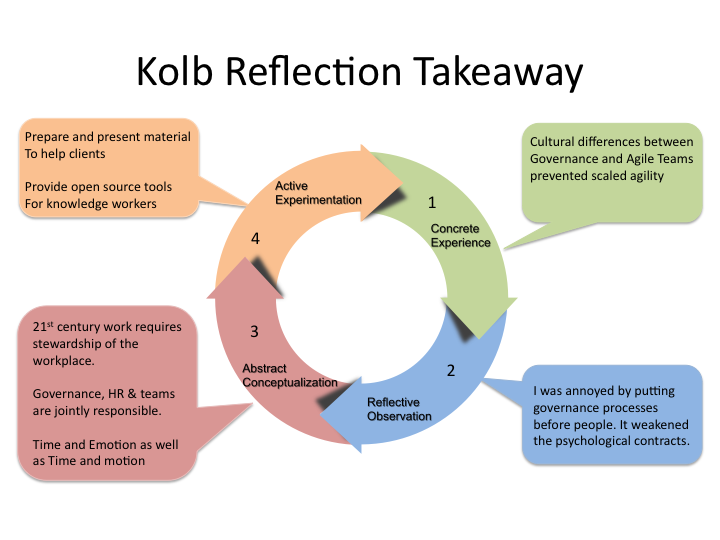
Kolb reflection is something I carry out every 6 months or so. At the time of writing I am at on the cusp between steps 3 and 4. My realisation that there is a need to help the middle line become more akin to stewards and thus help the spread of agile through a cultural approach to complement the scaleable processes. To that end I will be presenting at conferences later this year.
Agile teams are, mostly, transparent and reflective in the way they work. As I have found the tracking tool useful, especially for retrospective activities, I am more than happy to share it with anyone who cares to use it, test it, change it or request improvements.
In conclusion
- There are trends that suggest tacking of more of our working ways for our own personal use are increasing in number and diversity. This adds another boat to the rising tide.
- Harmonious work produces good results. Knowing how to improve your work environment through your own behaviour is free and easy to do. You are in control of what you track – not ‘The Man’
- Harmonic analysis of our work is easy using the tool. It can be carried out using a simple timesheet with a few more click to pick elements to collect the data – and then running a process over the data to produce a comprehensive, drill-down list as well as a nice interactive graph.
- Time and motion will be complemented by time and emotion.
- Middle manager roles will change to reflect the knowledge era. Governance will incorporate stewardship, coaching and facilitation.
- If you have evidence of your time and emotion you will be well placed to carve a career path while your competitors who are stuck with a production line mentality may not fair so well.
- Help yourself to the open source tools.
Tools to use
Let us know if you want to be informed of updates.